Lauterbach has released an integrated Linux debugger that combines two of the traditional methods of debugging.
The option is available in the latest software release for all Trace32 users with a debugging licence for ARM.
This latest approach combines two types of debugger used to develop embedded Linux applications.
To implement the destination hardware, a JTAG debugger is first used. As soon as the main features of the embedded Linux application are running on the destination hardware, GDB is often used in the first step of the debugging process.
In stop-mode debugging using a JTAG debugger, both the processor and the entire system stop at a breakpoint. Information about the processor and the destination hardware can then be displayed over the JTAG interface.
Run-mode debugging using GDB, on the other hand, only halts the selected process while the main system continues running.
Phone: 02 9687 1880
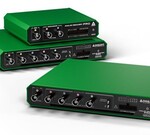
Digilent Analog Discovery Pro 2440 mixed signal oscilloscopes
The Pro 2440 mixed signal oscilloscopes from Digilent feature an arbitrary waveform generator...
Optek AF26 VIS/NIR sensor
The Optek AF26 VIS/NIR is a high-precision dual-channel colour sensor for inline operation.
Teledyne FLIR TG268 thermal imaging spot temperature camera
The thermal imaging spot temperature camera is designed to reduce diagnostic time and simplify...


